
2026 Midyear Data Breach Report
Posted September 4, 2026
Download PDF (1.49 MB)
Posted: September 04 2026
Executive summary
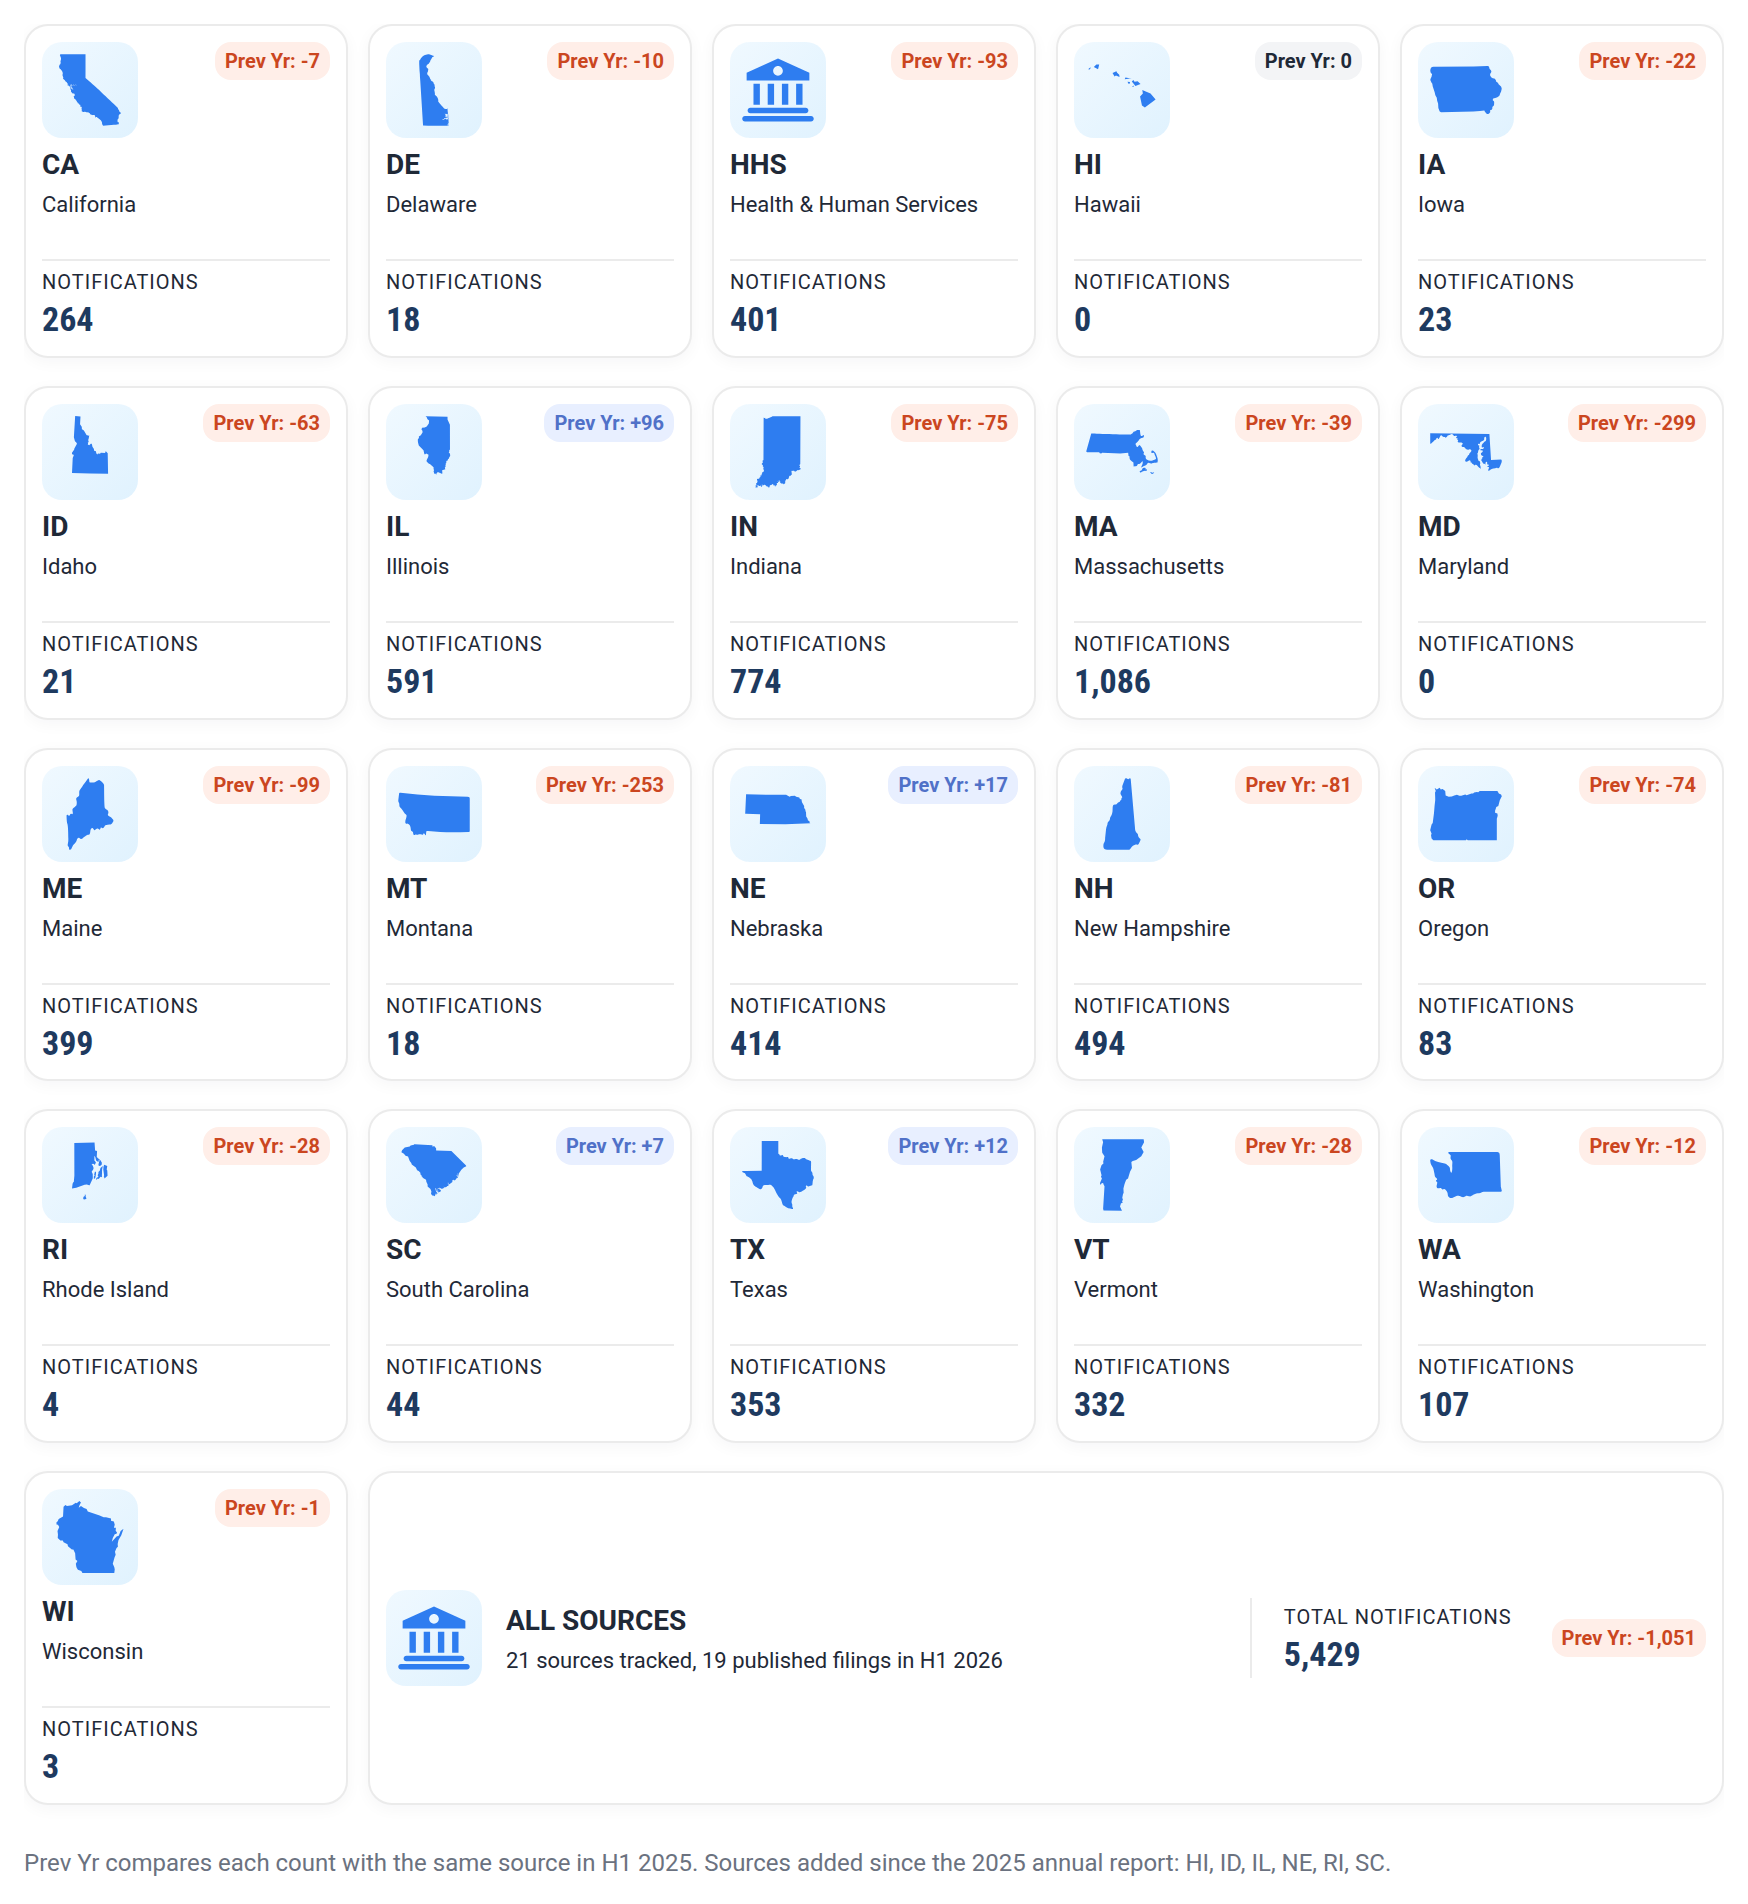
In the first half of 2026, 20 state agencies, most of them attorneys general, and the U.S. Department of Health and Human Services (HHS) published 5,429 data breach notification filings. By our count those filings describe 1,969 distinct breach events and affected at least 343 million people.
A single breach dominated the statistics, accounting for nearly 80 percent of the 343 million total. In April, attackers compromised Canvas, the learning management system owned by Instructure and used by schools across the country. A breach listing in Wisconsin recorded the incident as affecting 275 million users. Every other reported breach was far smaller. The next largest were AssuranceAmerica at 7.0 million people, Carnival Corporation at 6.0 million, Medtronic at 3.8 million, TriZetto Provider Solutions at 3.4 million, QualDerm Partners at 3.1 million, and Texas Parks and Wildlife at 3.1 million.
Because of the Instructure breach, the education sector led all sectors in affected individuals, at 279.5 million. The sectors behind it were an order of magnitude smaller: business services at 25.1 million people affected, healthcare at 20.2 million, and financial services at 12.2 million.
The first half of 2026 also crossed a milestone for this project. In March, the Data Breach Chronology recorded its 100,000th breach notification since 2006. Our full dataset is available at privacyrights.org/data-breaches.
About Privacy Rights Clearinghouse
Privacy Rights Clearinghouse is a nonprofit organization founded in 1992 and committed to advancing data privacy for all by expanding access to information, increasing participation in policy discussions, and advocating for stronger rights. We have tracked data breach notifications since 2005, and our Data Breach Chronology database contains information about publicly reported breaches, built from notification filings published by state agencies and the U.S. Department of Health and Human Services. Anyone can explore it at privacyrights.org/data-breaches, and the full dataset is available to download at store.databreachchronology.org. Purchases of the database, grants, cy pres awards, and donations fund its development and keep access free for data privacy and security researchers.
Methodology
State and federal data breach notification laws require organizations to report breaches to government agencies. Many of those agencies publish what they receive, but the format and what they share varies. Our 2026 survey of state notification laws found that 36 states require a report to the attorney general or another agency, and only 21 make what they receive public (privacyrights.org/resources-tools/reports). Some publish a summary table that describes each breach in general terms, some publish the full notification letter sent to consumers, and some publish both. From those formats, we collect every notification we can, normalize the filings, and extract their contents. The Data Breach Chronology therefore reflects the breach landscape as the notification laws surface it, as opposed to documenting every breach that occurs. Many breaches never appear at all, especially those that affect fewer people than required by a state’s reporting threshold.
We track notifications and group them by breach event using the information available. This is a challenging task because a single breach usually produces many varying notifications across different states and over time. Our published counts report events rather than individual filings, and for each event we use the largest affected count reported across its filings. Those figures count exposures of personal information rather than unique people. We attribute each event to the half of the year in which it was first reported.
For this edition, the Chronology tracked 21 sources, 20 state agencies and HHS, of which 19 published filings in the first half of 2026. Six state sources have been added since our 2025 annual report. The figures reflect a snapshot taken on August 14, 2026, and later filings will revise the totals over time.
The first half of 2026 by the numbers
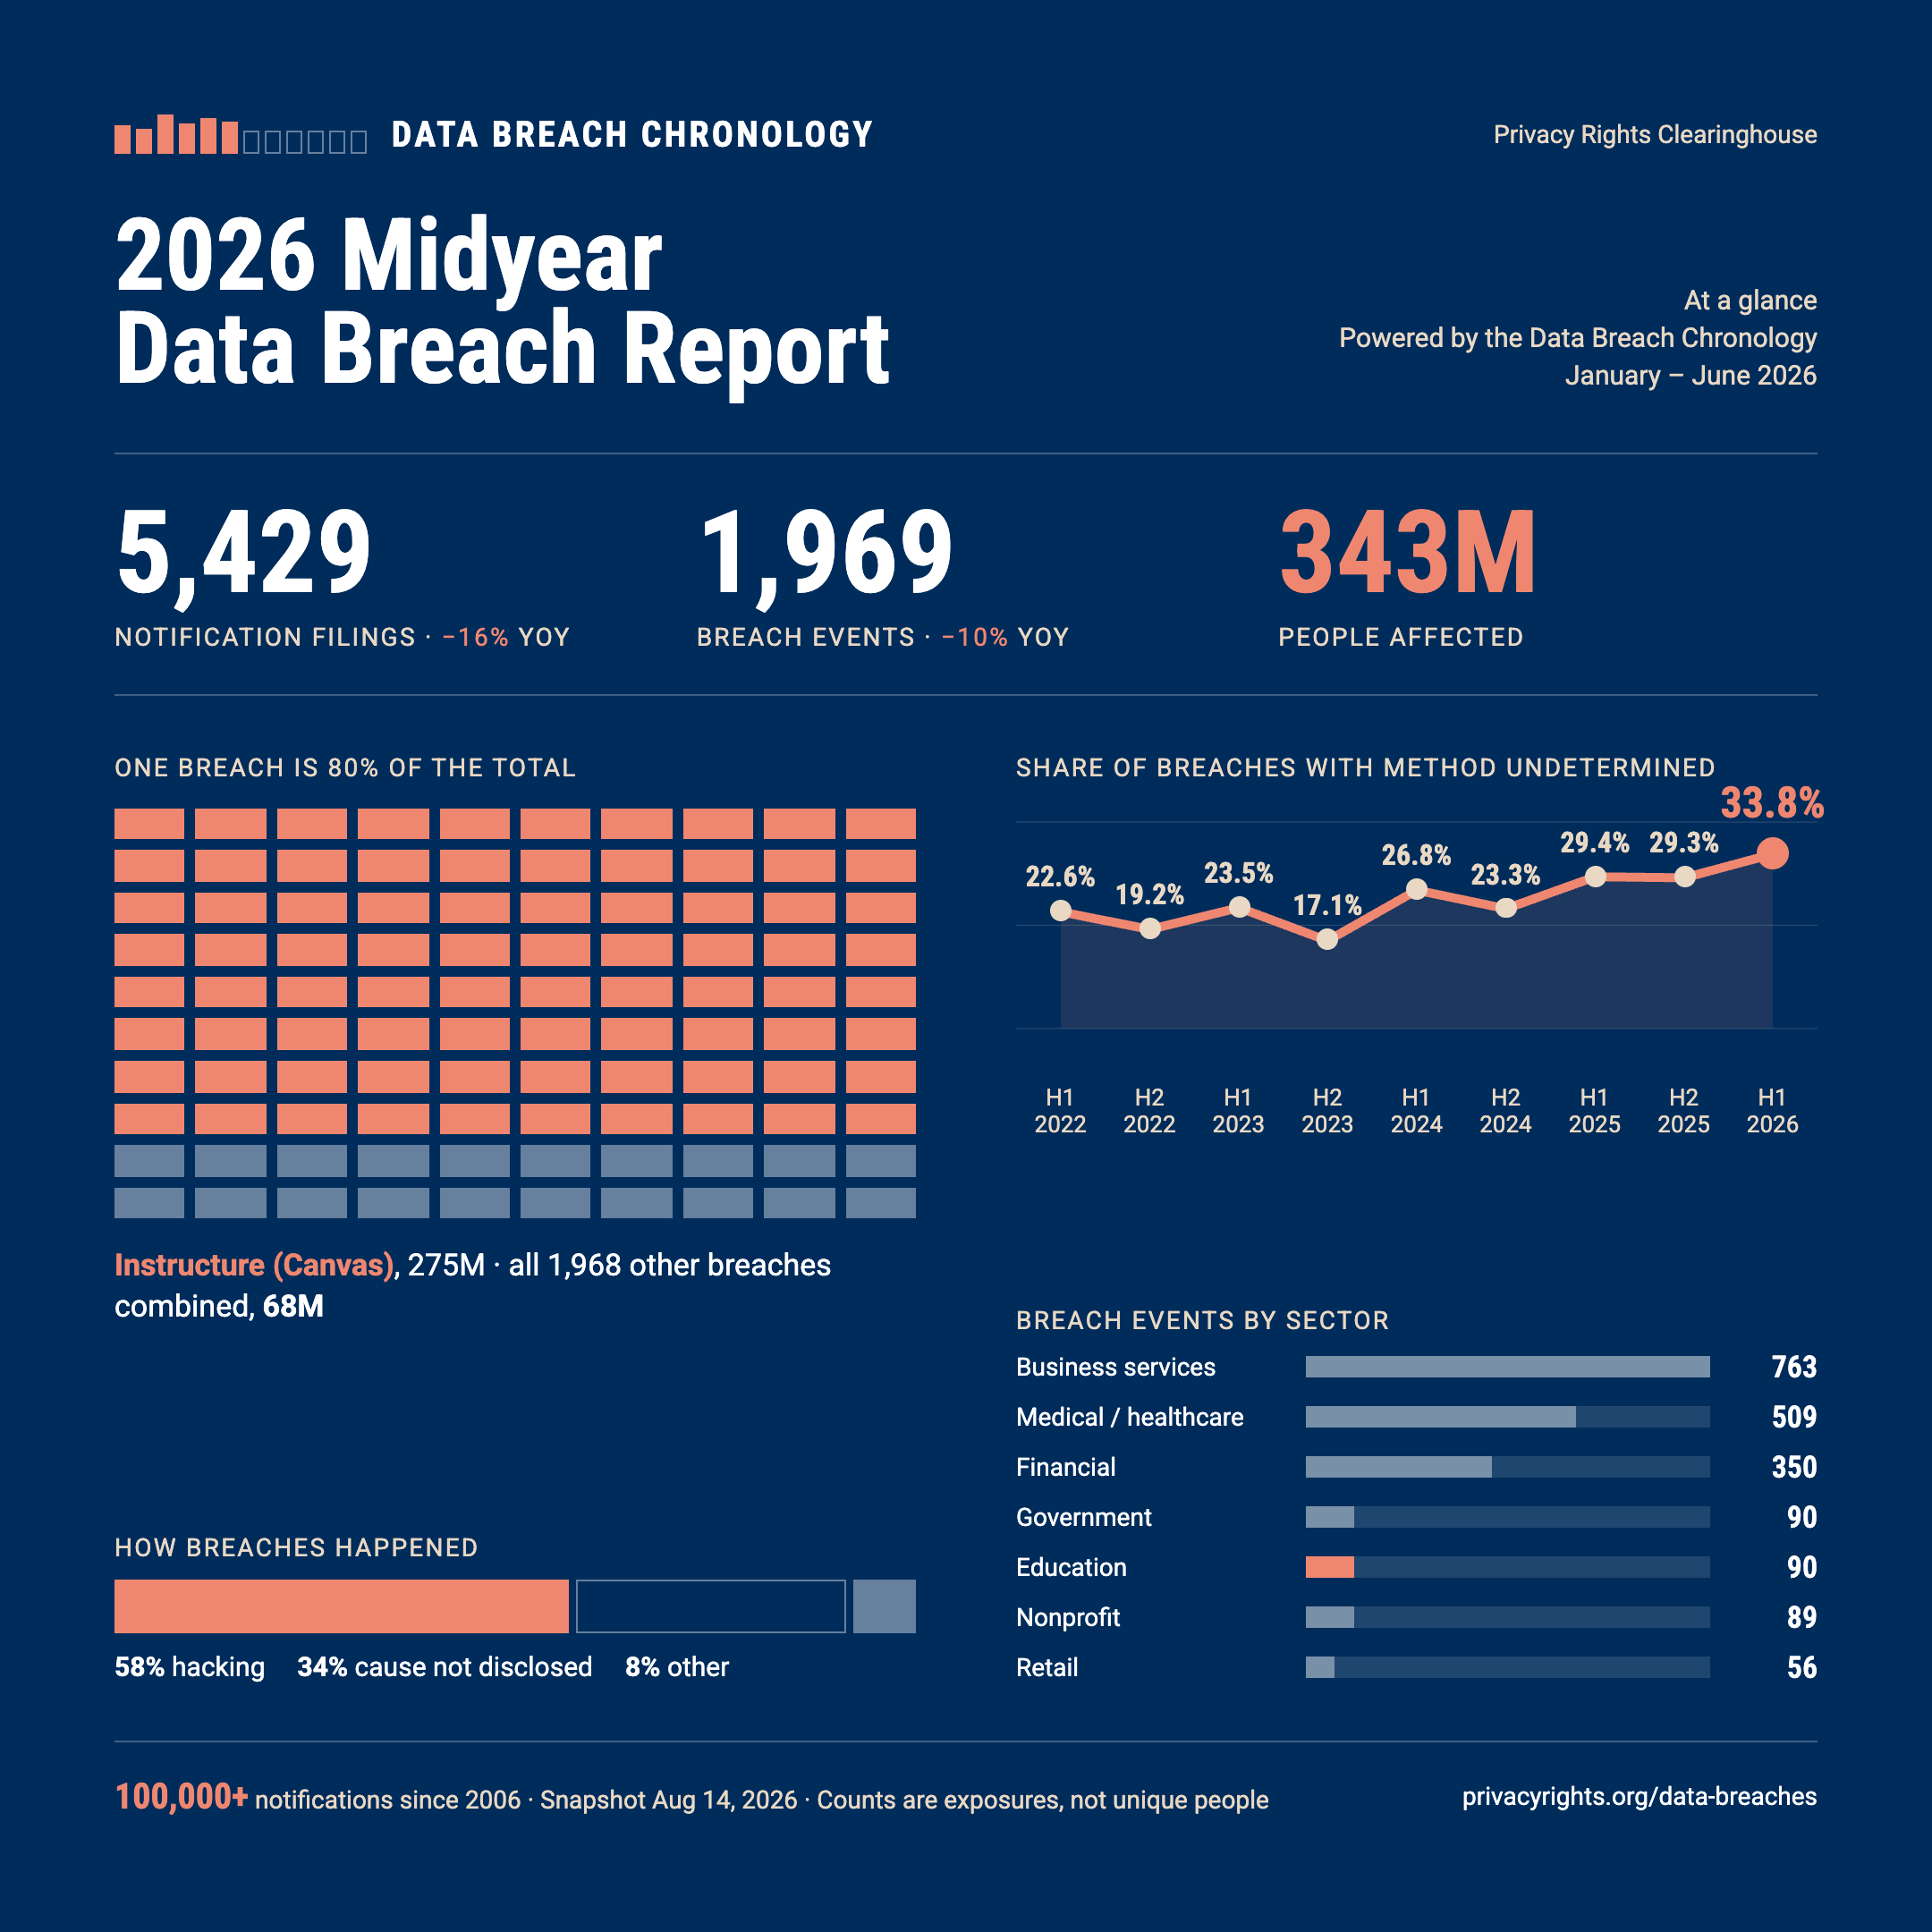
In the first half of 2026, the Data Breach Chronology recorded 5,429 breach notification filings describing 1,969 distinct breach events. Notifications fell 16 percent from the first half of 2025, and events fell about 10 percent.
| H1 2025 | H1 2026 | Change | |
|---|---|---|---|
| Notification filings | 6,480 | 5,429 | -16% |
| Breach events | 2,184 | 1,969 | -10% |
| Individuals affected (exposures) | 142.8M | 343.1M | see below |
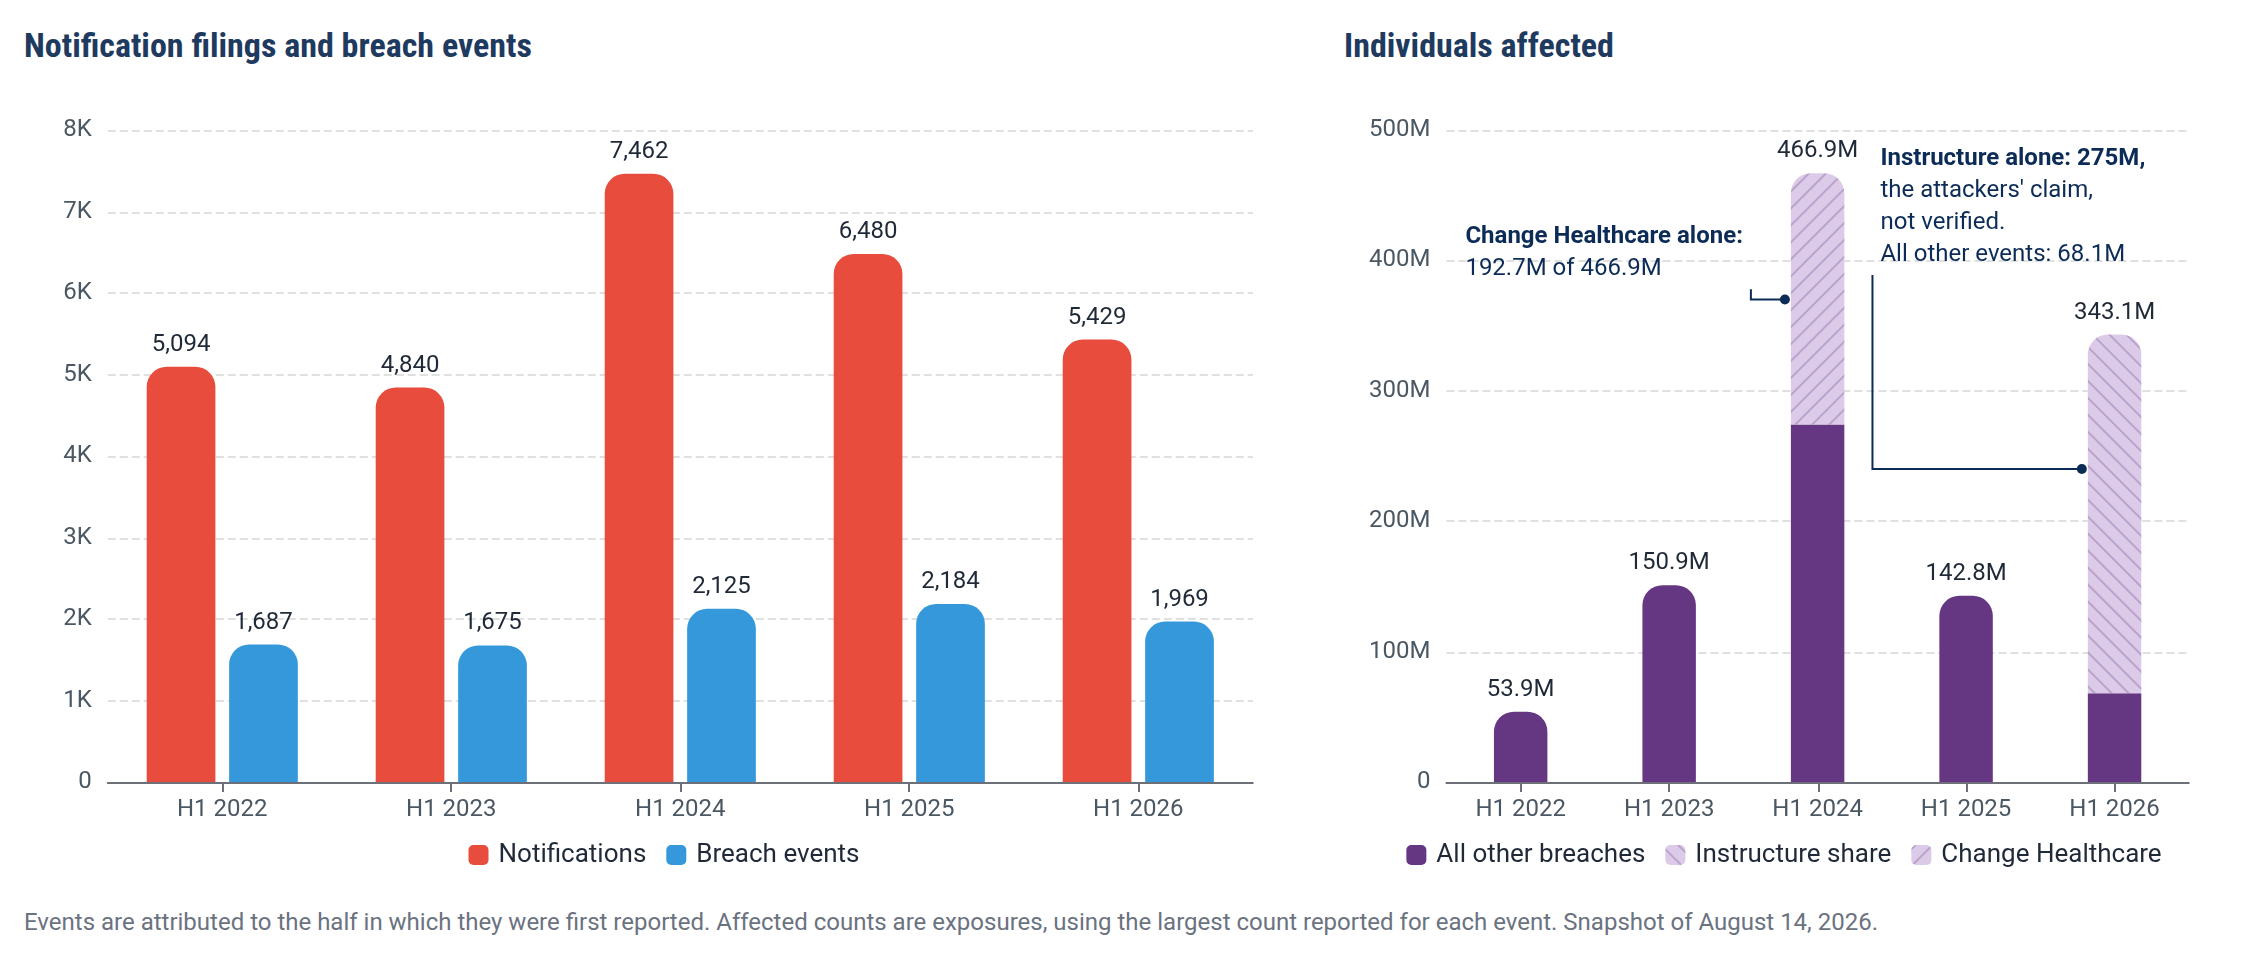
A single breach accounts for most of the report period’s affected total. The Instructure (Canvas) breach alone makes up about 80 percent of the 343 million people affected that the half’s filings report. Without that breach the total falls to roughly 68 million. That 343 million is itself uncertain because the true count of people affected in the Instructure breach is unverified, which the report discusses below.
Who was breached
| Organization type | Events | Affected |
|---|---|---|
| Business, other | 763 | 25.1M |
| Medical / healthcare | 509 | 20.2M |
| Financial | 350 | 12.2M |
| Government | 90 | 4.7M |
| Education | 90 | 279.5M |
| Nonprofit | 89 | 1.2M |
| Retail | 56 | 0.3M |
Education shows 90 events but 279.5 million affected, almost all of it the single Instructure breach.
Business services, healthcare, and financial services accounted for most of the events. One sector stands out less for its totals than for its trend. Breach events at law firms and legal services providers have climbed from 64 in the first half of 2022 to 113 in the first half of 2026. The full-year count rose from 137 events in 2022 to 207 in 2025, and the sector’s share of all breach events rose from 3.8 percent to 5.7 percent over the same five first halves.
How breaches happened, and what was exposed
| Breach type | Events | Share |
|---|---|---|
| Hacking | 1,149 | 58% |
| Unknown | 665 | 34% |
| Accidental disclosure | 102 | 5% |
| Insider | 23 | 1% |
| Physical / portable / card | 30 | 2% |
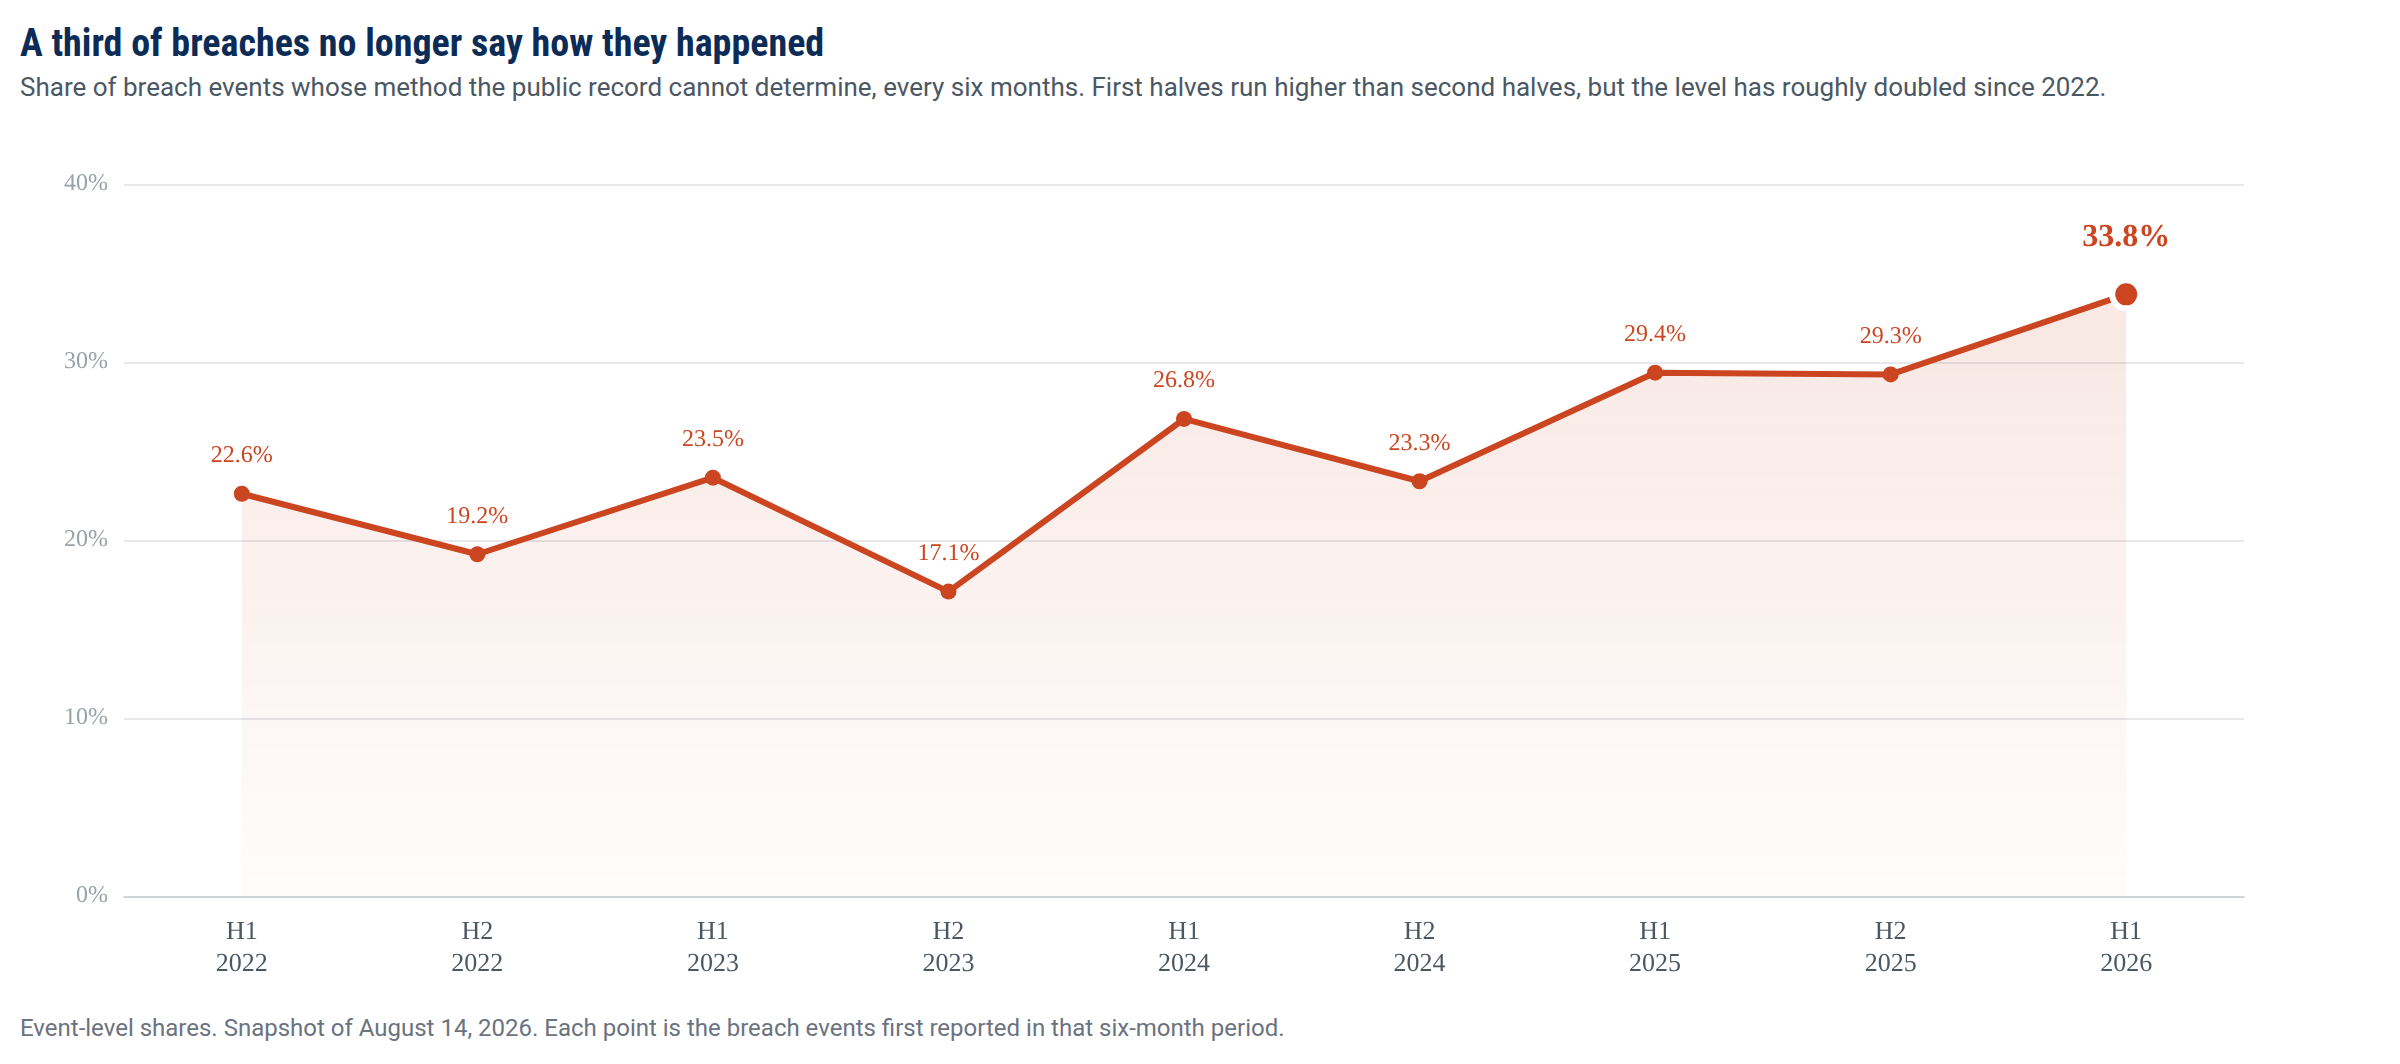
Hacking remains the most common reported breach method at 58 percent of this half’s breach events. The more telling number is how often the record names no breach method at all. The cause of 33.8 percent of breach events, one in three, could not be determined from public filings this half. That share has trended upward since 2022, when it stood at 22.6 percent.
This is largely a reporting effect. A growing share of what agencies publish is a summary table with no notification letter attached, and where the letter is missing the cause usually is too. Over the same period the share of breaches whose letter is public has fallen, from 70 percent to 62 percent. But the reporting gap doesn’t explain everything. Even among the breaches whose full letter is public, the share we cannot classify has more than doubled since 2022. The public record is saying less about how breaches happen, and it is saying less even where it is most complete.
Where the record identifies what information was exposed, it points to sensitive data more often than not. Financial account information appears in 43 percent of those events and health information in 42 percent. Where a state publishes neither the notification letter nor a field for the exposed categories, the record shows nothing about what data was taken.
Largest reported breaches
| Organization | Reported | Affected |
|---|---|---|
| Instructure (Canvas) | from May 7 | 275,000,000 |
| AssuranceAmerica | June 15 | 6,998,886 |
| Carnival Corporation | May 27 | 5,995,277 |
| Medtronic Inc. | June 28 | 3,834,294 |
| TriZetto Provider Solutions | February 6 | 3,433,965 |
| QualDerm Partners | February 22 | 3,117,874 |
| Texas Parks and Wildlife | June 26 | 3,087,721 |
| Navia Benefit Solutions | March 18 | 2,700,000 |
| Nacogdoches Memorial Hospital | March 12 | 2,507,073 |
| Insightin Health | January 16 | 1,949,534 |
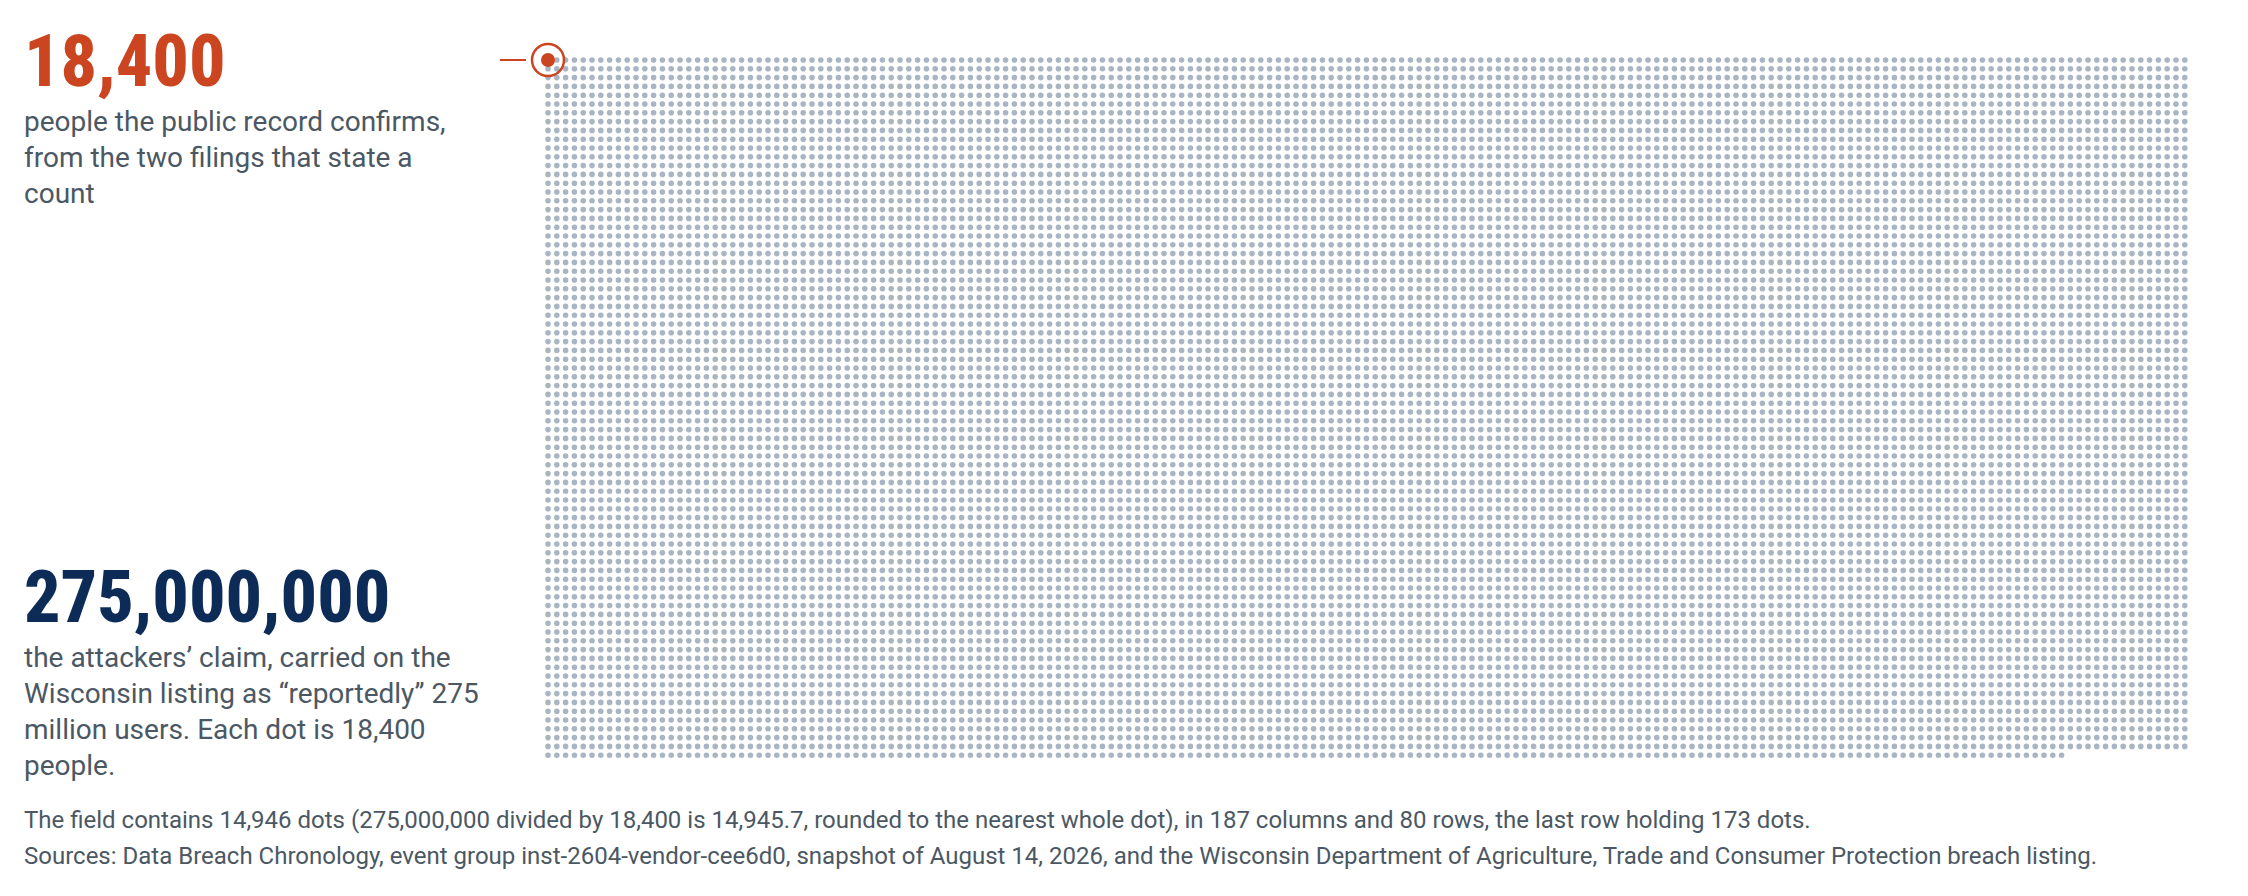
The Instructure figure of 275,000,000 is the attackers’ unverified claim, carried on a single Wisconsin listing. Across all fifteen filings, the public record confirms about 18,400 people. See the Instructure section below.
Several of the largest breaches were at service providers, companies whose compromise reaches many client organizations at once.
Instructure: a platform breach across thousands of schools
In PRC’s 2025 data breach report, we warned that a breach of a single education platform could expose students across thousands of schools at once. The example we studied then was PowerSchool.1 In April 2026, it happened again. Attackers broke into Canvas, the learning management system that Instructure says serves more than 30 million users at more than 8,000 institutions, and it became the largest breach of the first half of 2026.2
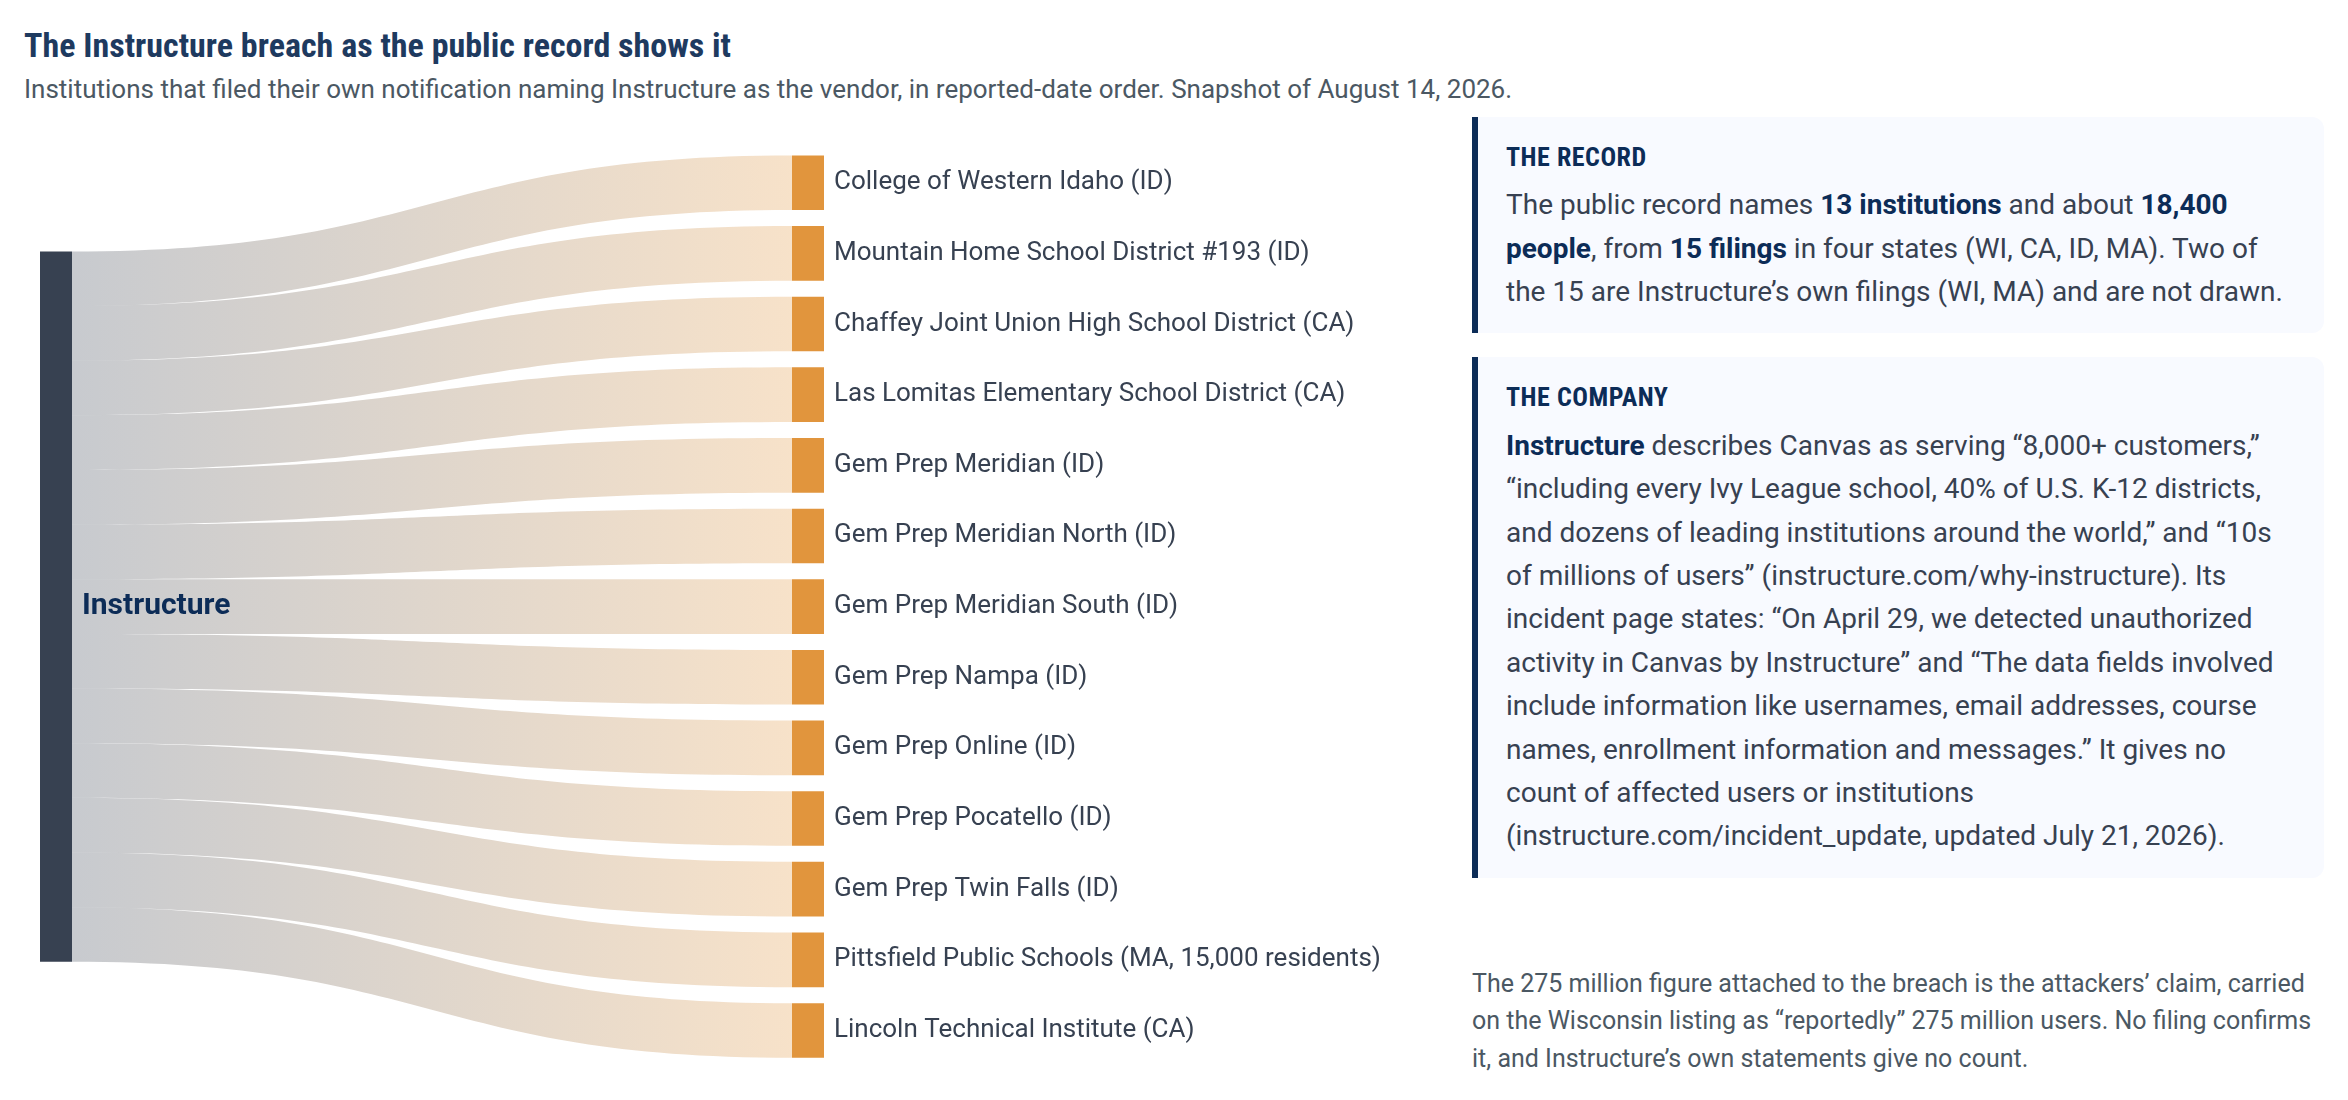
According to Instructure, it detected unauthorized activity on April 29, and a second intrusion followed on May 7.3 The company says the attackers accessed usernames, email addresses, course names, enrollment information, and messages, while passwords, dates of birth, government identifiers, and financial information were not involved.4 An extortion group called ShinyHunters claimed the attack, and on May 11 Instructure paid to have the stolen data returned and destroyed, a payment its own incident page describes only as an “agreement with the unauthorized actor”.5
To date, Instructure has not released a statement confirming the total number of individuals affected by the breach. In the case of most breaches, a company must report only to the states where victims reside. So a breach that reached thousands of institutions entered the record as just fifteen filings, from Wisconsin, California, Idaho, and Massachusetts, and only Massachusetts requires a resident count. Some state forms request a nationwide total even though no statute requires one, and companies often supply it, so the record sometimes carries a larger figure than the resident counts alone. Despite the undeniable enormity of the breach, across all fifteen publicly available filings, our database totals approximately 18,400 people affected by the breach, or 275,000,000 if you include the Wisconsin filing quoting the attackers.6
What the first half of 2026 tells us
Service provider breaches concentrate risk
So far this year, the largest breach was not at a school but at a platform that thousands of schools depend on, and a single intrusion put every institution that used it at risk. This is the pattern worth watching. When one vendor holds data for many organizations, a single compromise can ripple across all of them at once, and a single incident can dominate a half year of breach statistics, as the Instructure breach did this period.
The same dynamic ran through the largest breaches of last year. Change Healthcare, a claims processor, reached far beyond any one provider. Conduent handled records for scores of health plans and public agencies. And PowerSchool, like Instructure, sat beneath thousands of schools. We examined each in our 2025 report. They share a position more than a size: they are the infrastructure other organizations run on, so a breach at one becomes a breach at hundreds. As more services consolidate onto shared platforms, this is the kind of incident the record will keep surfacing, and the kind a notification system built around individual companies is least equipped to capture.
The largest breaches are frequently poorly documented in public filings
The method behind one breach in three cannot be determined from the public record, a share that has trended upward since 2022. The Instructure breach is the clearest case: an incident that may have reached millions was reduced, in the record, to fifteen filings and a single number supplied by the attackers. As a rule, the larger a breach and the more organizations it touches, the more of it falls outside what any one filing captures.
The pattern is not new. National Public Data, a broker that held records on hundreds of millions of people, entered our record as a handful of filings before it went bankrupt in 2024, its true scale never reported. Much of the opacity traces back to how breaches are disclosed. A growing share of what agencies publish is a summary table with no notification letter attached, and where the letter is missing, the cause usually is too. The public record ends up thinnest exactly where the stakes are highest, on the breaches that reach the most people.
Explore, download, support
The data behind this report is public and free to use. Anyone can explore the Data Breach Chronology at privacyrights.org/data-breaches and download the full dataset at store.databreachchronology.org.
This is the first half-year report built on version 2.5 of the Data Breach Chronology, which we rebuilt in early 2026. Version 2.5 added thirty new fields, six new state sources, and vendor tracking that names the third party behind a breach and links each affected organization to it, and it is that vendor tracking that let this report follow the Instructure breach across the institutions it reached.
To follow breaches as they are filed, subscribe to Breach Watch, our newsletter on notable breaches entering the record. Purchases of the database, grants, cy pres awards, and donations fund the Data Breach Chronology and keep access free.
Download the 2026 Midyear Data Breach Report
The full report, formatted for print and citation.
Notes
- Privacy Rights Clearinghouse, 2025 Data Breach Report (January 2026), PowerSchool case study, at privacyrights.org/data-breaches. Return to text
- Instructure company figures for Canvas usage (more than 30 million users, more than 8,000 institutions across 100-plus countries), instructure.com. Return to text
- Instructure, “Canvas Security Incident Update,” instructure.com/incident_update. Return to text
- School notification letters (Pittsfield Public Schools, MA; the Gem Prep letters, ID) in the Data Breach Chronology. Return to text
- Susan D’Agostino, “Instructure Pays Ransom to Canvas Hackers,” Inside Higher Ed, May 11, 2026; “Data stolen in Canvas hack that hit thousands of schools has been returned, company says,” CNN, May 12, 2026. Return to text
- Data Breach Chronology, event group inst-2604-vendor-cee6d0, August 14, 2026 snapshot; Mass. Gen. Laws ch. 93H, § 3(b). Return to text